Sunday, March 31, 2013

Back again to Africa

In this third and final post in the series of my African DNA segments (click here to see parts one and two), I'm going to be looking at my paternal grandmother's DNA results. According to 23andMe, grandma has a little segment of African DNA on her 9th chromosome, comprising about 3.9% of the chromosome. This one is different from the segments found in my paternal grandfather and maternal grandmother's tests, however, in that the DNA is identified as North African, while the other two were both Sub-Saharan African.


Let's start the comparison by looking at the Dodecad admixture tool, which has four African populations. According to their chromosome painting tool, grandma shows positive for Palaeo-African, and possibly Northwest African a little to the right of the Palaeo-African.

 
When I pull up the numbers for Dodecad, both Palaeo-African and Northwest African are zeroes, but East African shows 2.2%.


This is much less than the 3.8% predicted by 23andMe. Not a very good match-up, but at least this tool's breakdown and the graph both showed African DNA.

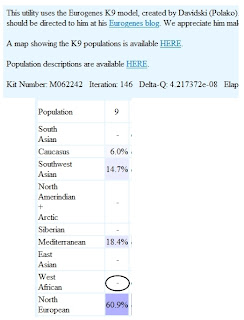
On to Eurogenes' admixture tool. It only has one African population, West African, which shows up quite clearly on chromosome 9.


When we look at the percentage breakdown, however, West African comes up empty.


Given the size of the other populations assigned to chromosome 9, the African segment may have just been too small for the calculator to detect. Or it may have just been absorbed into the ethnicities surrounding it. Whatever the reason, the numbers and the graph don't agree for this section of this chromosome.

Now for the HarappaWorld admixture tool. This one has four African populations, and I can pick out three of them in the graph - San, Pygmy, and West African. I'm not sure if Pygmy is the largest of the three, or just stretched out by the graph tool.


The numbers show hits in two populations, Pygmy and San, but no West African. Pygmy is quite a bit smaller than San. The total percentage of African DNA that HarappaWorld sees on chromosome 9 is 0.5%. This is drastically smaller than either 23andMe or Dodecad, 3.3% and 1.7% smaller respectively. I wonder why they see the same stretches of DNA so differently.

And finally, the MDLP tool. This tool has three African populations, but grandma only showed positive for Pygmy DNA.


And what do the numbers show? No African DNA at all.


That's the second tool that has shown grandma having African DNA in the graph, but not in the percentage breakdown. With no breakdown, I don't have any numbers to compare to the other two that did give me percentages for the African DNA. But the graph agrees that there is African DNA there.

What have I learned from going through all of this? Several things:

1. Admixture analysis is far from being an exact science. The chromosome painting offered by one tool can, and often does, disagree with the percentage breakdown of the same tool. Clearly there's some fine tuning still to come in this.

2. Even when multiple tools do agree on the general ethnicity of a segment, they disagree (sometimes wildly) on the segment's size. I think this is part of #1, but it was interesting to see (especially in my paternal grandmother's DNA) the varying sizes of the African DNA segments. I wonder if this is due to the ongoing work to determine the origin of the various AIMs or SNPs used in these calculators, or just the way the computer tallies the info.

3. Although the numbers disagreed with the populations shown in the graphs, every graph on every tool showed African DNA in the same place of the same segment of the same chromosome. This was the most interesting part. All the projects (I'm assuming) are based on different base populations, from different regions and using varying numbers of people. But they all showed African DNA just where 23andMe originally did. I don't know how conclusive that is overall, but until someone comes up with a pretty reason to reject this hypothesis, I'm going to believe that all three of my grandparents analyzed have these little chunks of African DNA.

4. If my hypothesis is correct, and this really is African DNA that's showing up my grandparents' DNA tests, that means I have three African ancestors somewhere back in my ancestry, one in each of my grandparents' family trees. Given the size of the segments, that ancestor is probably too far back to trace to by paper genealogy, unless I hit a HUGE stroke of luck one day. But it's fascinating to see something in my genealogy that I probably would never have seen any other way.

5. My mom's DNA test showed her as having the same African segment as my maternal grandmother, but no other. She only has half of my maternal grandfather's DNA, so I'd have to test my aunt and uncle to see if his side had any African. I'd like to do that someday, time and finances willing.

Tuesday, March 26, 2013

Another DNA Surprise

After researching my grandmother's little sliver of African DNA, I thought I would do the same for my grandfather's DNA test. According to 23andMe, grandpa has a little sliver of African DNA on chromosome 6. Using a technique I learned from a member of the DNA Newbie mailing list, I found that this segment is somewhere around 3.1% of the total chromosome.


After the interesting time I had trying to corroborate the African segment in my grandma's DNA on other admixture tools, I wanted to do the same with grandpa's and see what the tools had to say. I should note here that some of the admixture tools found African DNA on other chromosomes (which you'll see in some of the screenshots below), but for this blog post I'm sticking with just the solitary African segment 23andMe found.

First up, Dodecad. The Dodecad tool features three African populations - East African, Northwest African, and Palaeo-African. The graph of this section of chromosome 6 showed both Neo-African and Palaeo-African, with a little dash of Northwest African at the far right of the segment.


And what did the numbers show? That on this chromosome, he is 1% Neo-African, 1.6% Palaeo-African, but no Northwest African interestingly. That makes makes this chromosome about 2.6% African.


So the numbers and graph matched 2 for 3 on this one. Next, let's look at Eurogenes. This tool only has one type of African DNA, labeled West African. Grandpa has a pretty good chunk of it, as you can see here.


The numbers breakdown for Eurogenes said grandpa's chromosome 6 is 2.3% West African. That's pretty close to the 2.6% Dodecad gave me.


So this test shows African DNA in both the graph and numbers. Looking good so far! Now to look at the HarappaWorld admixture tool. HarappaWorld has four African populations - San, East African, Pygmy, and West African. I don't see any San in the graph, but I do see the other three represented. West African shows up the most, followed by East African, with a little bit of Pygmy in between.


When I turn to the numbers, East African doesn't show up at all, yet Pygmy does at .3%. West African dominates at 2.1%, for a total of 2.4% African DNA on this chromosome. That fits in nicely with the 2.3% and 2.6% from the other two. So the graph has three hits, but the numbers only have two. Still, this is looking pretty consistent.
Finally, let's look at MDLP's admixture tool. MDLP has three African populations - Pygmy, South African, and Sub-Saharian. There are little tiny bits of Pygmy DNA a little after the 120M mark, but much more past the 130M mark, so that's a hit. The South African and Sub-Saharian segments are much larger, so grandpa scores positive for all three types of African DNA in this test.

Looking at the numbers for this tool, grandpa has hits in all three populations. On this chromosome, he's got 0.9% Pygmy, 1% South African, and 0.1% Sub-Saharian. That puts his total African DNA on this chromosome at 2.1%, pretty close to the other three. Personally, I think the graph shows Sub-Saharian as the largest of the three, but I think the tool uses different functions or algorithms to print the graph and the numbers breakdown. Either way, the graph shows hits in three African populations, and the numbers match that.

So what does this all boil down to? Between the five DNA analysis tools, all five of them showed African DNA at the same spot on chromosome 6. The graphs on all five tools showed the African DNA, and the percentage breakdowns all verified it as well, though in two cases, populations represented on the graphs did not appear in the numbers. The amount of African DNA varied slightly between tools, with a low of 2.1% and a high of 3.1%. But basically they all told the same story - that my grandpa has a little chunk of DNA that they all believe came from Africa.

So far, that's two different ancestral lines with African DNA in them, both probably very remote, but still there. Amazing to think of the places that little bit of DNA has been, and where it came from originally. I wonder if I still carry it, whether my kids carry it? It'd be a shame for its millenia-long journey to end here. But at least I can let my descendants know it was there.

Thursday, March 21, 2013

Wordless Wednesday - Philena Beilstein


This is a photo of my 2nd-great-grandmother, Philena "Lena" Emily Beilstein. I really like this photo because the picture is so clear. This was taken around 1905. It looks like there was another person in the picture but he (I'm guessing it's a he, because the shoulder is taller than Lena, and looks to be a dark-colored suit) was cut out. Lena got married in 1903 to David Briscoe, and in 1907 to Clarence Johnson, so it could possibly have been either of them. Either way, it's a great shot of Lena when she was young, before all the trials and hardships she would later endure.

Friday, March 8, 2013

Genes Day Friday - Wait, I have WHAT in my DNA?

After reading a post on Roberta Estes' DNA-Explain blog about using trying to learn more about the tiny chunks of minority DNA in your test results, I thought I'd give it a shot. After 23andMe revamped their admixture calculator (now called Ancestry Composition) my maternal grandmother's DNA test surprised me by showing her as having 0.1% African DNA on chromosome 3.

If my math is correct, that means she would have one 8th-great-grandparent with 100% African DNA (which we all know is impossible, since everyone in the world is a mixture of several groups). Roberta suggested going to Gedmatch.com and using the admixture tools they've incorporated on their site, to see what else you can discover around those tiny minority segments. Since I uploaded grandma's test to Gedmatch right after I first got her results, I was able to dive right in. While I still have a lot to learn about how to make full use of these tools, I was able to at least figure out how to go in and look for confirmation of the African segment. What I found was both enlightening and confusing.

First, let's look at the MDLP World-22 admixture tool. According to their admixture breakdown, grandma has 0.8% Pygmy DNA on chromosome 3. This is confirmed by the graphic representation of chromosome 3, with the bright red segment (circled for your convenience) shows the segment in question.


So their calculations match up with 23andMe in terms of percentage and location of African DNA. So far, so good. 

Next up, let's look at Dodecad. The graphic view of chromosome 3 shows Neo-African, West African, East African, and Paleo-African DNA, all lumped together in the same spot where MDLP showed Pygmy DNA.

But when I go to the admixture calculations, all the African values read zero.


Why would the graph show African, and the numbers not? I don't know.

Now we'll look at Eurogenes K9 model (and no, it has nothing to do with dogs). Here, the graph shows West African DNA, in the same spot on chromosome 3 as the others.


And here again, the admixture calculations for chromosome 3's West African DNA read zero.


Again, I'm at a complete loss as to why the graph would show West African DNA, but the admixture breakdown does not.

Finally, the last of the Gedmatch admixture tools, HarappaWorld. Their graph shows Pygmy, West African, and a smidge of East African DNA, again in the same spot on chromosome 3 as the others.


And what does their admixture calculator show? Nothing, as far as African DNA is concerned.

 
I'm sure there's a good explanation for this, and I'll be asking around on the DNA mailing lists I'm on to figure out what's going on. But it kind of makes me wonder what other numbers are wrong. Going through all 23 chromosomes, on four different admixture tools will take some time. But as far as I'm concerned, the African DNA seems to be there - all five graphs found it, in the same spot on the same chromosome, and two sets of admixture calculations did too. In my mind, that's evidence enough.
 
For me, the next step will be finding DNA matches who also share this African segment on their DNA, to see if I can't trace where in grandma's family lines this little nugget came from. Of all the minorities in the world, I never expected to find DNA from Africa in my family tree, so I'm excited to see what I can learn about it.

Wednesday, March 6, 2013

Wisdom Wednesday - I'm off to Germany!

Photo courtesy of depositphotos.com
I'm going to Germany! Well, virtually at least. I just signed up to take the Germanic Family, Local and Social History Research class through BYU's Independent Study program. I'm excited because I've always wanted to know more about German genealogy research (I've got German ancestry on all four of my grandparents' lines). Plus, it's the last course I need to finish the genealogy-family history certificate at BYU. It looks pretty intense, as the teacher's stated goal is to prepare you for the Germany accreditation test through ICAPGEN, which is something I plan on doing anyways. So it's a win-win for me. I have one year to complete the whole course. Hopefully it won't take me that long. I want to take some time with it, learn the material as best I can, and put it to practice as soon as I can. Here's to higher education!

Wordless Wednesday - Cathedral of the Immaculate Conception

Here are a few pictures of the Cathedral of the Immaculate Conception in Saint John, New Brunswick, Canada. I found these pictures somewhere online some years ago (way back when I first started doing genealogy and didn't cite my sources. I've learned my lesson since then). My great-great-grandparents John Gibson and Catherine Cain were married here on 8 Sep 1879.
Before the spire was added


After the spire was added
Inside the Cathedral

Saturday, March 2, 2013

My first client

Photo courtesy of educationcloset.com
I just finished the research and reporting of my first genealogy client. What an experience that was! She gave me a pretty good amount of info on the ancestor whose ancestry she wanted researched, and was open to just learning anything about that side of her family I could find. I took the starting ancestor and his parents, and was able to find all of his grandparents, six of his eight great-grandparents, and solid immigration info on two families of his ancestors. Plus some odds and ends of various relatives, interesting historical tidbits.

It was really interesting to see how involved I became in researching this family. It almost felt like I was researching my own family, that's how keen I was to keep looking trying to puzzle out who was who, and where they lived, and could I find their parents if I looked in one more place. It was really hard to stop searching, to say I'd found enough to write about, and move on to the reporting phase. But you have to draw the line at some point, because (as every genealogist knows) you're never really done.

A few highlights from the experience - maybe it's the detail freak in me, but I got a kick out of citing a source or two for every fact I stated in the report. Just knowing that I had documented evidence for each and every item in that report felt good! I puzzled for a day or two on how to find one particular ancestor, and spent some time reviewing the documents that I had, analyzing the clues in them, and drew what I felt was a solid conclusion. Then, a couple days later, I found a newspaper article that gave the name of this particular ancestor, and it turned out to be exactly the person I'd concluded it was. That felt good too!

But the highlight of the whole thing was my client's reaction to my findings. She expressed how excited she was to learn so much about her family, and how meaningful it was to know more about where she comes from. That to me is one of the main reasons I do genealogy - to get that feeling of belonging to a family, to a people, to a country, that you're tied to by history and blood and life and death. To help someone else feel that is just about the best feeling in the world. And one I look forward to having over and over again by helping others research their family history.